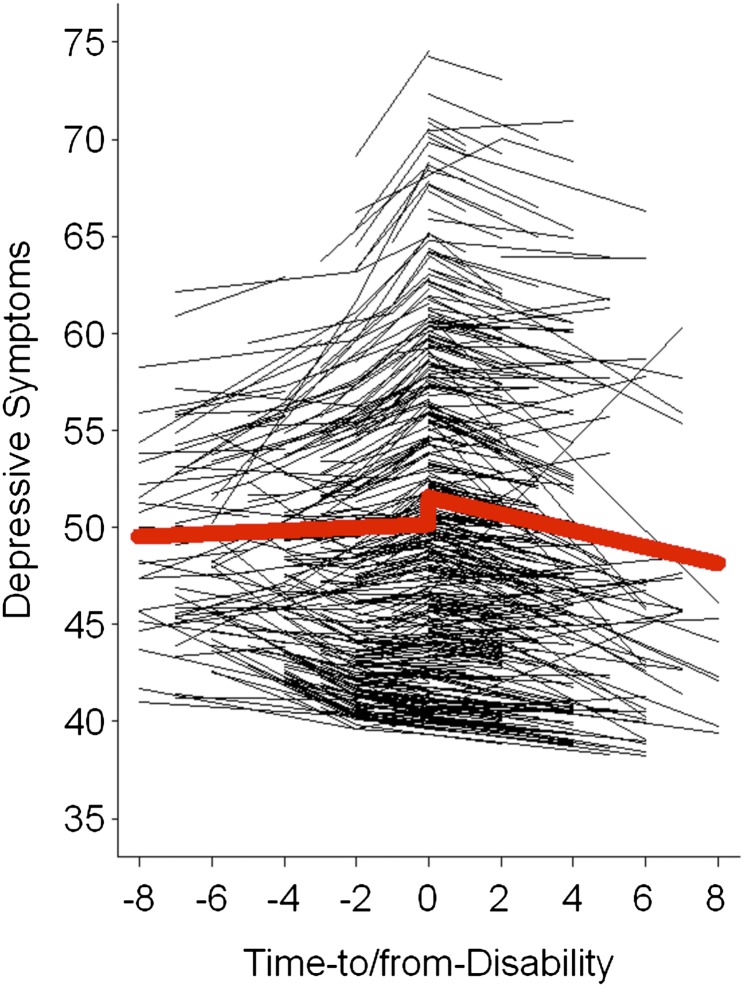
Figure 1.
The figure graphically illustrates predicted average change (thick line) and individual changes (thin lines) for depressive symptoms over time-to/from disability. On average, depressive symptoms increased slightly with approaching disability, increased considerably at disability onset (i.e., first wave of measurement in which a participant needed assistance in personal activities of daily living), and declined after disability had set in.

