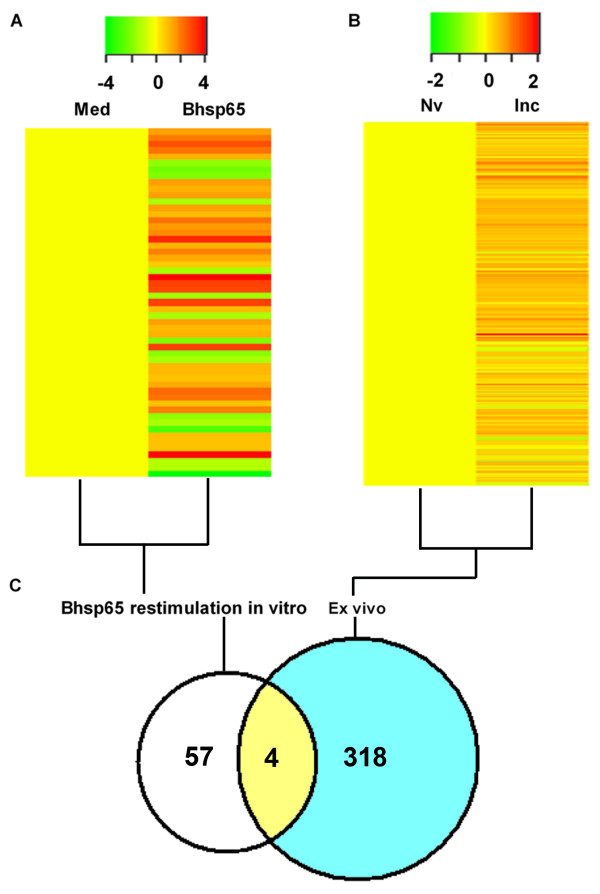
Figure 3.
Comparative gene expression profiles of antigen-stimulated lymph node cells in vitro and unstimulated lymph node cells ex vivo in preclinical arthritis rats. A heat map representation of the DEGs of LNCs of different groups of rats is shown. (A) LNCs harvested from Lewis (LEW) (RT.1l) rats on day 7 after heat-killed Mycobacterium tuberculosis H37Ra (Mtb) injection (preclinical AA) were cultured in vitro for 24 hours with or without mycobacterial heat shock protein 65 (Bhsp65). (B) LNCs harvested from naïve (Nv) rats and from rats with preclinical arthritis (Inc) were tested ex vivo without culture in vitro. The results were compared as indicated in the figure. (B) Part of Figure 1 included for easy comparison with (A). Red represents upregulated expression, and green indicates downregulated expression. (C) Venn diagram showing the relationship of DEGs in LNCs tested ex vivo versus Bhsp65-restimulated LNCs. DEG: differentially expressed gene; LNC: lymph node cell; Med: medium.

