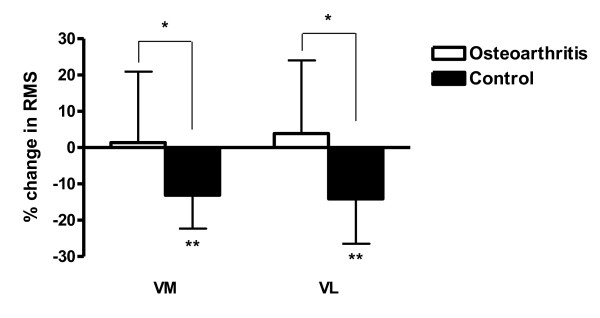
Figure 5.
Change in quadriceps surface electromyography amplitude following vibration. Percentage change in quadriceps surface electromyography (EMG) amplitude following vibration in the osteoarthritis and control groups. RMS, root mean square of EMG signals; VL, vastus lateralis; VM, vastus medialis. *Significant difference between groups (P ≤0.005). **Significant change from zero (P ≤0.001). Data are means and standard errors of the means.

