
Figure 3.
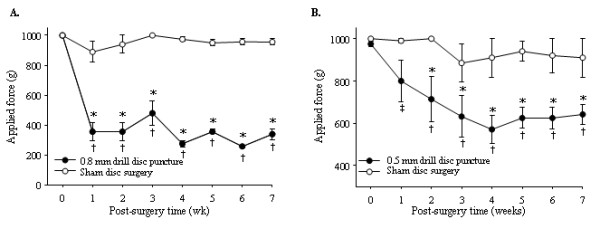
Behavioral pain assessments over a seven-week time period. Pressure hypersensitivity of the lower back was determined by measurement of the vocalization threshold to an applied force gauge (algometer). (A) Graph showing data derived from animals that underwent traumatic puncture by a drill (0.8 mm in diameter and 0.64 mm2 area) (n = 12) compared with the sham surgery group (n = 12). *P < 0.001 versus sham group; †P < 0.001 versus presurgery baseline (time 0). (B) Graph showing data derived from animals punctured with a smaller drill (0.5 mm in diameter and 0.25 mm2 area) (n = 6) were compared with the sham surgery group (n = 6). *P < 0.05 versus sham group; †P < 0.001 versus presurgery baseline; ‡P < 0.005 versus presurgery baseline.