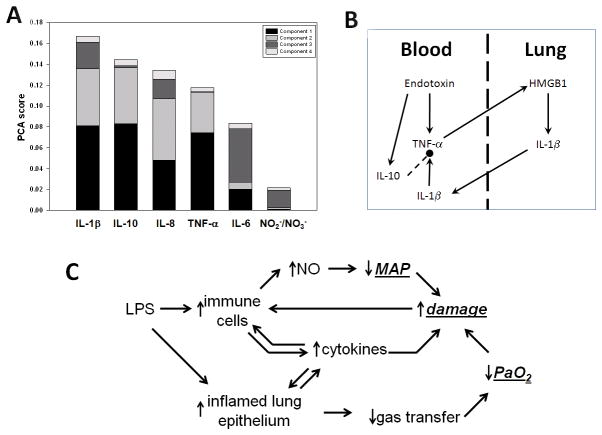
Figure 2. Principal drivers of inflammation and schematic of a mathematical model of endotoxemia.
Swine were subjected to endotoxemia followed by serial blood sampling and measurement of cytokines and NO2−/NO3− as described in the Materials and Methods. Panel A: Principal Component Analysis (PCA) was carried out on the time courses of all inflammatory analytes. The figure shows the sorted overall PCA score for each inflammatory mediator. Panel B: Schematic of hypothetical trans-compartmental inflammatory interactions inferred from PCA. Panel C: Schematic depicting overall structure of mathematical model of porcine endotoxemia.

