
Figure 8. Correspondence between individual model-predicted “damage” and Oxygen Index.
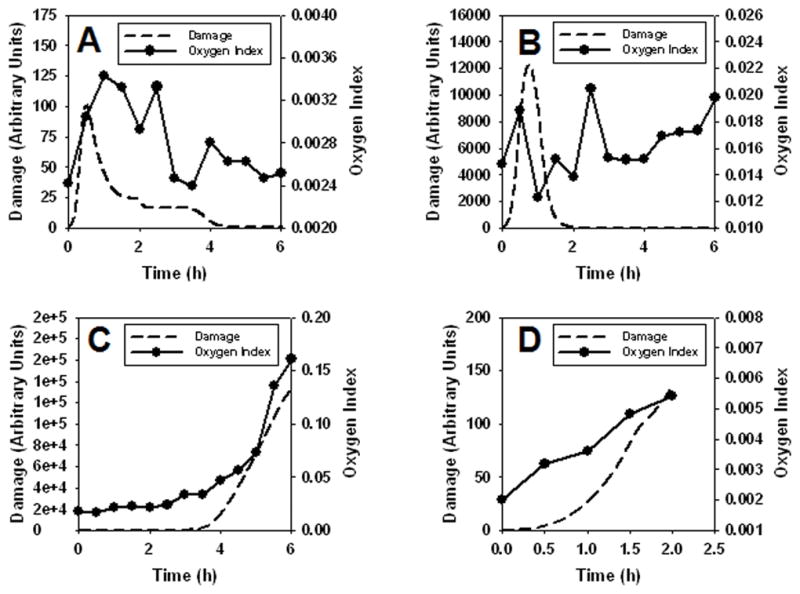
The damage variable, a combination of decreased PaO2, elevated inflammatory cytokines, and decreased MAP, causes overall damage to the system (dashed lines); this was compared to Oxygen Index (filled circles, solid lines) in four individual swine. Panel A: Pig 2588. Panel B: Pig 2595. Panel C: Pig 2583. Panel D: Pig 2589.