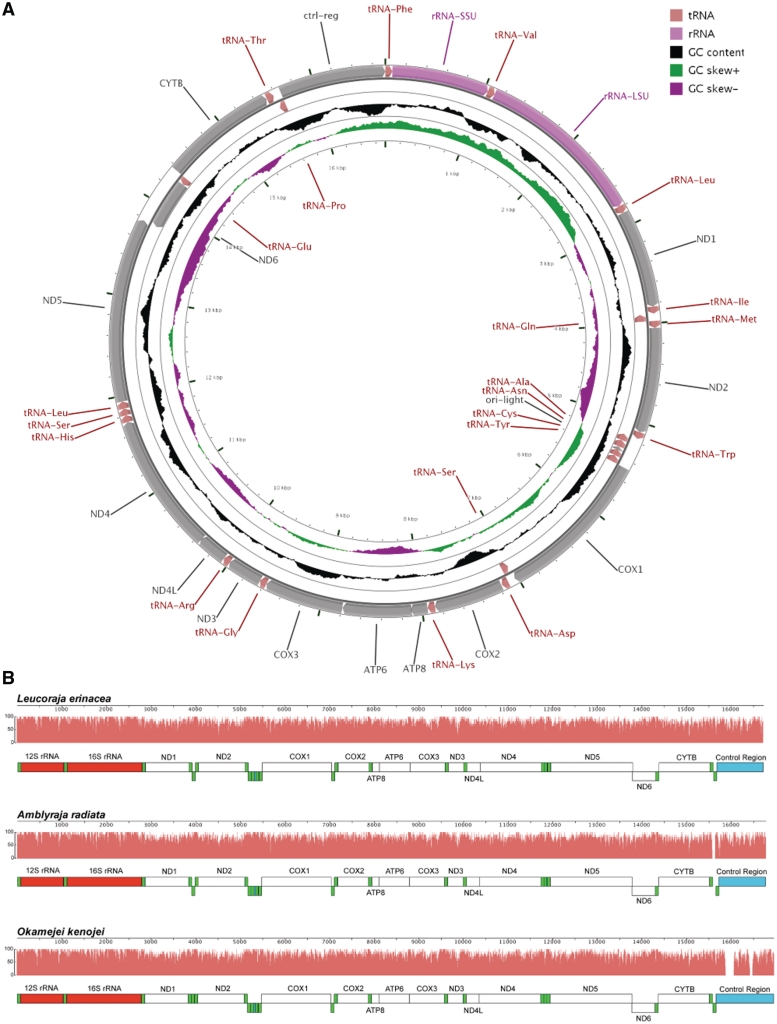
Figure 4.
Leucoraja erinacea mitochondrial genome. (A) Leucoraja erinacea mitochondrial genome with the consensus annotation for genes and other sequence features generated using CGView (29). The orientation of genes is shown with arrow heads. The tRNA genes are shown in pink, rRNA genes in purple and protein-coding genes in grey. The first inner circle shows the GC content above and below the average GC content for the mitochondrion in black. Positive GC skew is shown in green and negative in magenta. (B) The mitochondrial genomes of L. erinacea, A. radiata and O. kenojei are displayed using Mauve (16, 17), with rRNA features in red, tRNA features in green, protein-coding regions in white, and miscellaneous features in blue. The pink profiles indicate the sequence identity levels among the three genomes.

