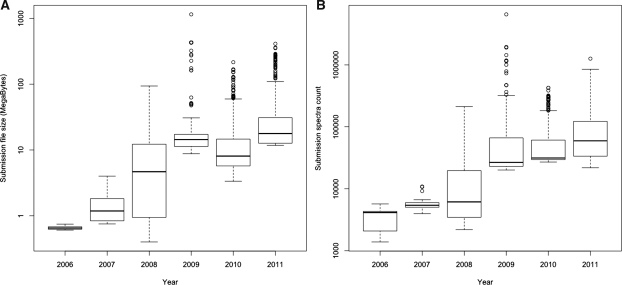
Figure 1.
(A) Top 20% largest submission file sizes and (B) top 20% highest spectra count per submission file over time. The top 20% percentage of the submitted files is shown in order to reflect to the state of the art methodology and MS machines applied. The figure shows that there was at least one order of magnitude increase in file sizes and about two orders of magnitude increase in spectra counts from 2006 to 2011.

