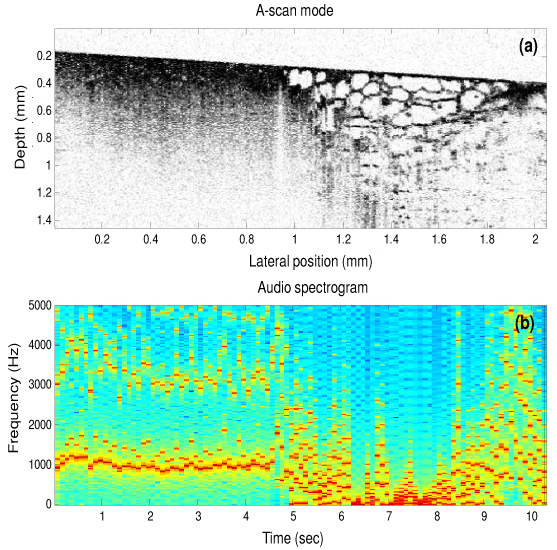
Fig. 5.

Sonification using the A-scan mode ( Media 1 (2.6MB, MOV) – both video and audio). (a) Human breast tissue containing a tumor margin with tumor (left side of the image) and adipose (right side of the image). (b) Audio spectrogram of the output sound, where each column in the spectrogram corresponds to 10 A-scans in the OCT image in (a).
