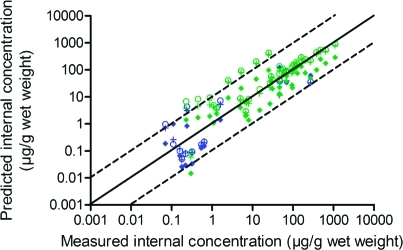
Figure 2.
Comparison of TK models: One-compartment A (○), one-compartment B (+), and PBTK (⧫), for the same chemicals for rainbow trout and fathead minnow (8 chemicals, 45 data points); blue: results for rainbow trout, green: results for fathead minnow (see also black and white graph in SI Figure S3).

