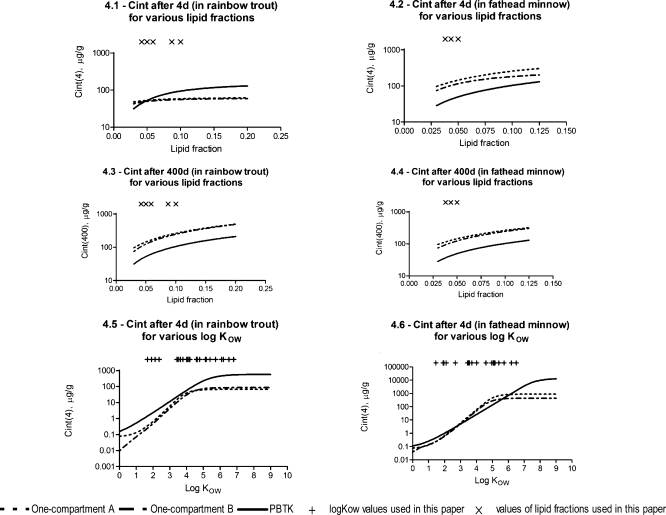
Figure 4.
TK model predictions for rainbow trout and fathead minnow: 4.1, 4.2: internal concentrations for various lipid fractions (after 4 d); 4.3, 4.4: internal concentrations for various lipid fractions (after 400 d); 4.5, 4.6: internal concentrations in both fish species for various log KOW (after 4 d). Simulation parameters: chemical concentration in inspired water: 100 μg/L; log KOW = 4.4; water temperature: 12.8 °C for rainbow trout and 24.8 °C for fathead minnow; body weight: 0.13 kg for rainbow trout and 0.00018 kg for fathead minnow; lipid fraction of body weight: 0.12 for rainbow trout and 0.05 for fathead minnow.

