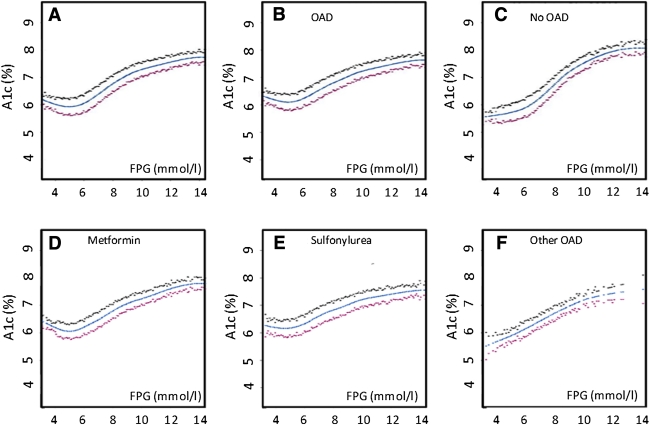
Figure 1.
Spline curves with 95% CIs of the relationship between FPG and A1C are shown for the total group (A), persons on an OAD (B), persons not on an OAD (C), and persons on metformin (D), a sulfonylurea (E), or any other OAD (F). (A high-quality color representation of this figure is available in the online issue.)

