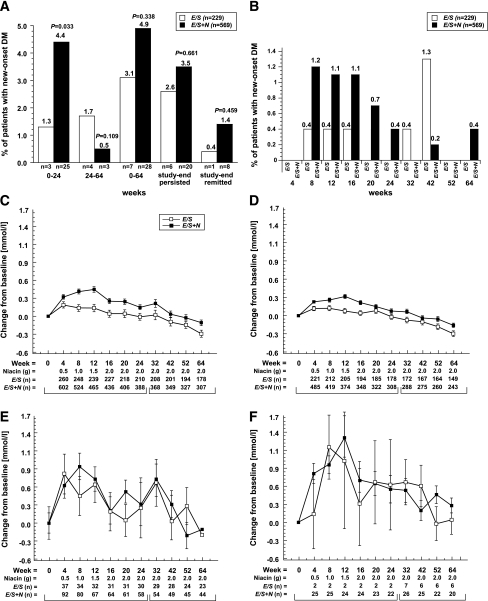
Figure 1.
Time course of new-onset diabetes and effects on FG. A: Summary of new-onset diabetes. Three pairs of bars on the left compare E/S versus E/S+N groups for patients without diabetes at baseline who developed new-onset diabetes during 0–24 weeks, 24–64 weeks, and cumulatively during 64 weeks. Two pairs of bars on the right enumerate those who developed diabetes and still met criteria for diabetes at study end or transiently met criteria for diabetes, then remitted by 64 weeks (2). Details of patients who met new-onset criteria are described in Supplementary Table 2. B: Frequency of patients who developed new-onset by treatment interval. Mean changes from baseline in FG were generated using an ANCOVA model with terms for treatment and baseline FG during 24 weeks and 24–64 weeks in the full cohort (C), in patients without diabetes at baseline (D) and with diabetes at baseline (E), and those who developed new-onset diabetes (F).

