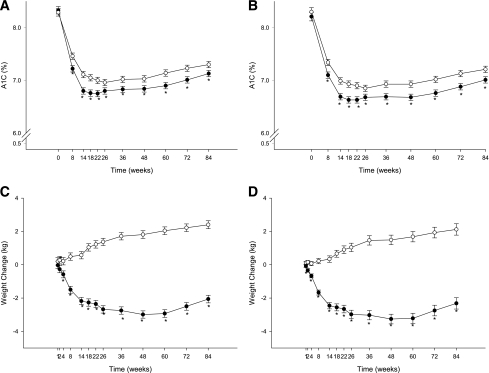
Figure 2.
Effects of EQW vs. IG on A1C and body weight over 84 weeks of therapy. A: A1C values over time for the ITT population. B: A1C values over time for the 84-week completer population. C: Body weight change over time for the ITT population. D: Body weight change over time for the 84-week completer population. ●, EQW; ○, IG. *P < 0.05.

