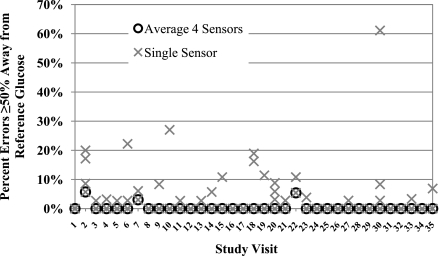
Figure 1.
Summary of very large errors, defined as sensor values ≥50% away from the reference venous blood glucose. Each study visit is depicted separately. The percentages of very large errors when the four sensors are averaged are shown by black open circles, and values for each single sensor are shown by gray Xs. Note the significant decrease in very large errors with the use of four sensors.

