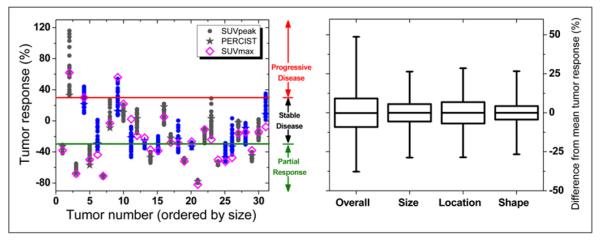
FIGURE 4.
Intratumor variation in SUVpeak responses. (Left) Responses of 31 tumors (ordered from smallest to largest) arising from different ROIpeak definitions. Responses of 12 tumors (in blue) were ambiguously classified as either progressive disease/stable disease (130%, solid red line) or stable disease/partial response (-30%, solid green line). SUVmax response and SUVpeak PERCIST response (1.25-cm-diameter sphere in highest-uptake region) are also shown. (Right) Overall variation in intratumor response and variation associated with changing size, location, and shape of ROIpeak. Boxes represent SD, whiskers show range, and solid line depicts median of response values.

