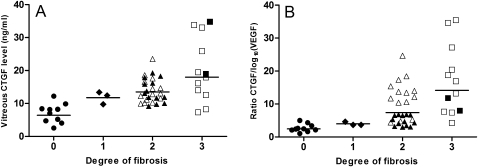
Figure 1.
Vitreous connective tissue growth factor (CTGF) levels (A) and CTGF/log10 (vascular endothelial growth factor; VEGF) ratio (B) per degree of fibrosis of the retina. Filled symbols: proliferative diabetic retinopathy group. Open symbols: bevacizumab group; means of each group are also presented. (A) Vitreous CTGF levels and degree of fibrosis correlated significantly (Spearman's ρ 0.6, p<0.001). (B) The CTGF/log10(VEGF) ratio and degree of fibrosis correlated significantly (Spearman's ρ 0.7, p<0.001).

