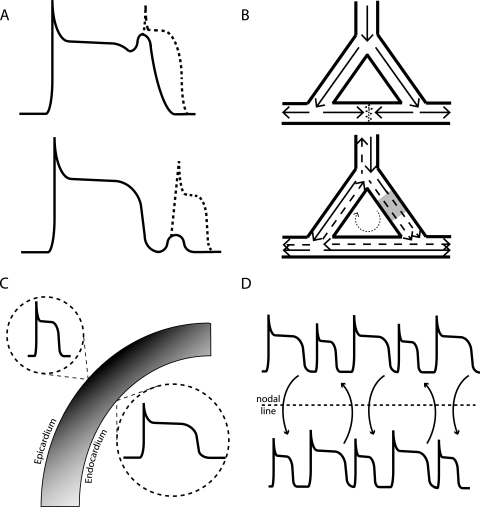
Figure 1.
Mechanisms contributing to arrhythmogenesis. (A) Triggered activity, the upper trace shows an early after-depolarisation (EAD) occurring during repolarisation. The lower trace shows a delayed after-depolarisation (DAD) occurring following repolarisation. Dotted lines indicate the generation of an extra action potential with a sufficiently sized after-depolarisation. (B) Re-entrant circuit, the upper diagram shows a normal pattern of excitation with impulse propagating equally at each bifurcation and extinguishing in the middle. The lower diagram shows an area of slowed conduction velocity in one of the branches. The normal impulse shown by the solid arrow does not get extinguished as indicated by the delayed dotted arrow, allowing it to excite the myocardium. The delayed impulse is then able to circulate around the junctions resulting in inappropriate excitation of the rest of the myocardium. (C) Spatial heterogeneities in the form of transmural gradients. The epicardial action potential duration is much shorter than the endocardial potentially leading to re-excitation. (D) Temporal heterogeneities in the form of discordant action potential duration alternans. Regions which alternate out of phase generate a line of block called the nodal line between them. This has the potential to act as a focus for re-entrant circuits following the addition of a triggered beat.

