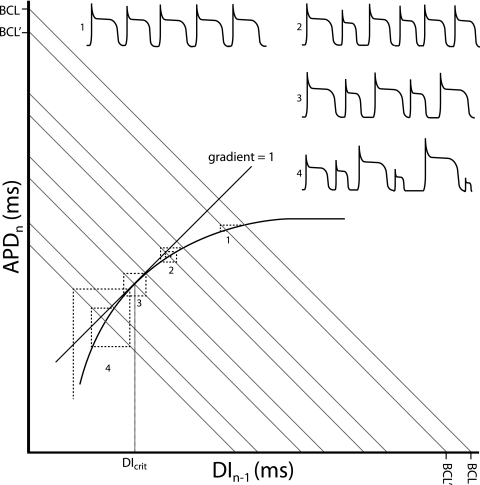
Figure 2.
Restitution curve with action potential duration (APDn) plotted against the previous diastolic interval (DIn−1). Both would be in the order of milliseconds. The thick curve shows the typical monoexponential relationship this provides. Corresponding action potentials (APs) are shown for each numbered point. As the sum of the APD and DI gives the Basic Cycle Length, BCL, this gives the equation APD=−DI+BCL which is in the form of the linear relationship y=mx+c, with m the slope and c the vertical intercept of the function. Hence BCL represents the y-axis and x-axis intercept connected by a line with gradient of −1 (grey lines). Moving from a given BCL to another results in an iterative process which takes the APD to a new steady-state value. This is represented by the dashed lines. Each time a dashed line crosses the restitution function an AP is fired. At (1) the change in BCL results in a rapid iteration to a new steady-state value. As the gradient becomes steeper, the system takes longer to reach the steady-state value, with (2) showing a transient set of alternans. When the gradient of the restitution function reaches unity (3), the system enters a stable positive feedback, never reaching a steady-state value and producing sustained alternans. The DI at this point is known as the critical diastolic interval, DIcrit, and represents the break-point between stability and instability. Finally, surpassing the DIcrit (4) results in an unstable positive feedback, with AP durations spiralling away from each other. This is likely to result in the occurrence of discordant alternans and wavebreak, leading to arrhythmia.

