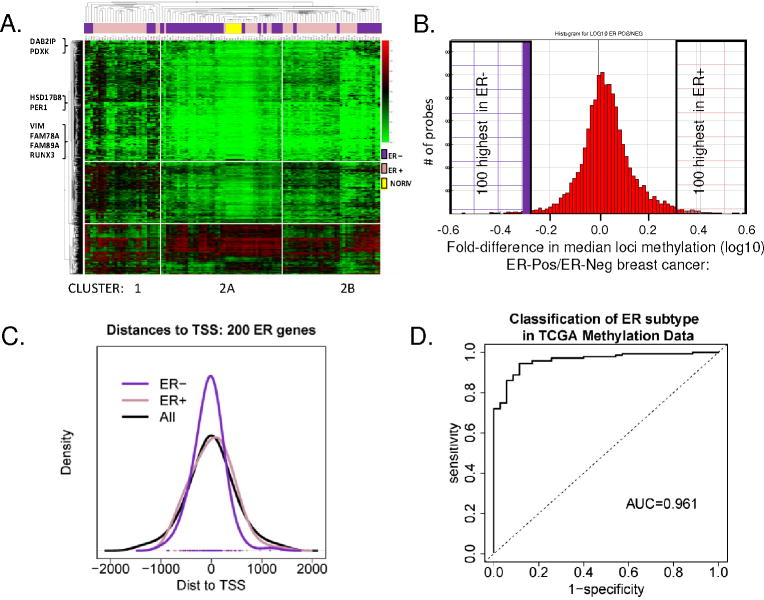
Figure 2.
A. Unsupervised hierarchical cluster analysis of the most varied 5% of CpG loci probes among tumors (1378 loci; SD > 0.160). 2D-hierachial cluster analysis was performed using the Manhattan distance on 103 tumors, and 1378 loci showed two distinct clusters. Cluster 1 is enriched for ER+ tumors (pink bars); Regions of Cluster 2 appear enriched for ER-negative tumors (purple bars). Normal organoids cluster together (yellow bars). Examples of breast cancer related gene loci are indicated at left. B. Histogram plot showing the frequency of loci differentially methylated in ER-positive and ER-negative tumors. Plotted on the X-axis is the fold-difference in the mean locus methylation of ER-positive tumors/ER-negative tumors, among 8376 loci with (SD>0.1 across all tumors). The 200 (left and right shaded boxes) are CpG loci most differentially methylated between ER-positive and ER-negative tumors. C. Distance to the transcriptional start site (TSS) of the top CpG loci identified in ER-positive versus ER-negative tumors. Location of 100 ER-positive (pink line), 100-ER negative (purple line) and all 8376 (black line) CpG loci was plotted relative to the TSS indicated as 0 on the X axis. D. Validation of ER Subtype Markers. An ROC plot shows AUC 0.961 for detection of ER-subtype in 50 independent tumors within TCGA, using the ER-specific 40 loci marker set (data in Figure 3, Supp Table 2, Supp Fig 2).

