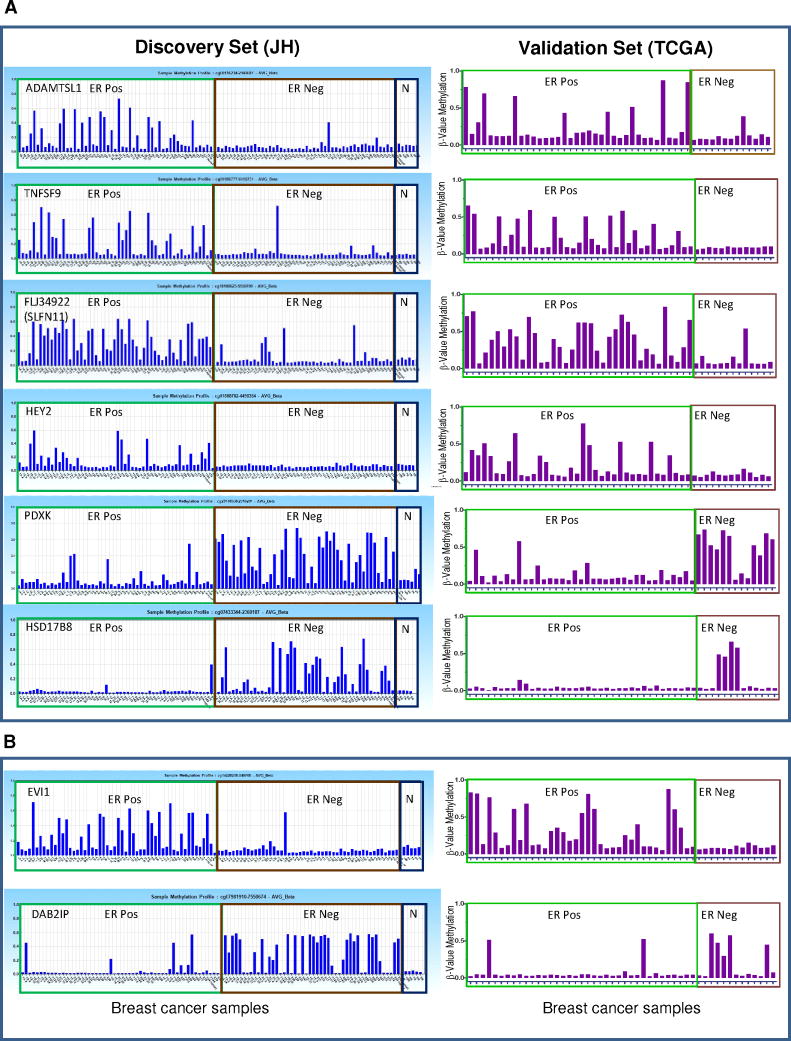
Figure 3.
CpG Methylation Biomarkers of ER-positive versus ER-negative subtypes in primary tumors. In the left panel (Discovery set, JH) CpG loci were evaluated using 103 primary tumors. The Y-axis: β-methylation, X-axis: Breast cancer samples, and N: normal breast organoids. The ER-status of the tumors is denoted on top of each box. Right panel (TCGA validation set), shows validation on an independent dataset (n=50) from TCGA. Shown are representative novel (A) and previously known (B) CpG loci specifically hypermethylated in ER+ and ER− breast cancers.

