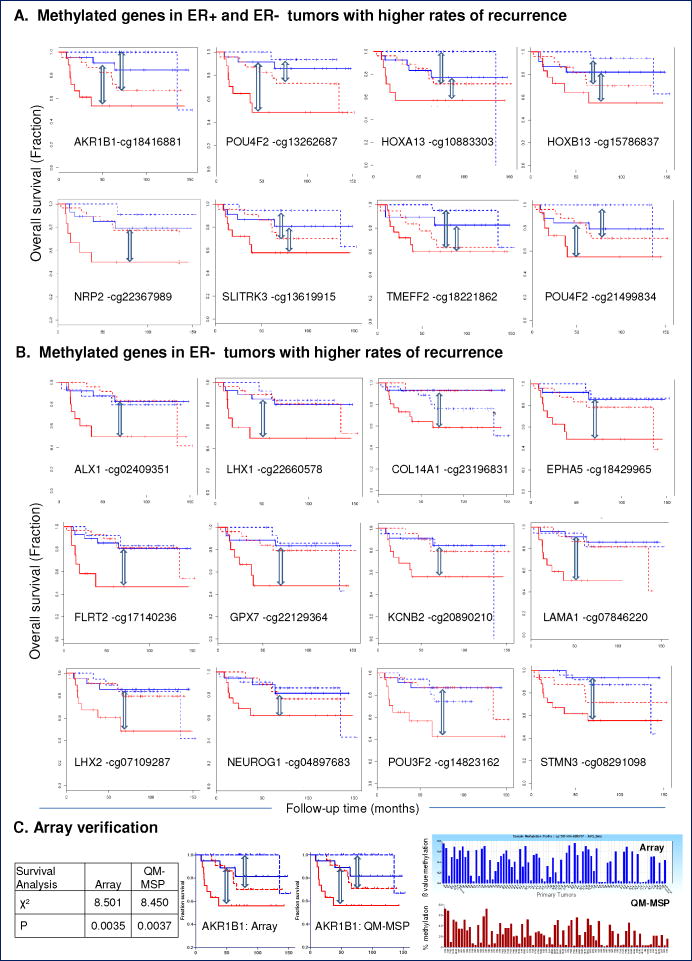
Figure 4.
Methylated CpG Loci Associated with Disease Progression.
Kaplan-Meier plots show CpG loci with strong associations between hypermethylation and high rate of disease progression among 82 tumors. Recurrence is shown for ER+ (dashed line), and ER-negative tumors (solid line). High (red line) and low (blue line) methylation was defined relative to the median methylation level for a given CpG loci within ER subtype. CpG loci associated with a high rate of recurrence in (A) ER+ and ER-negative breast tumors. (B) ER-negative breast tumors. Cox regression p-values for each of the 100 CpG loci set is presented in Supp Table 4A. (C) Verification of HumanMethylation27 array data (top panel, blue bars) by QM-MSP analysis (bottom panel) for AKR1B1. X-axis: Tumors; Y-axis: methylation levels (β-value for array, % methylation for QM-MSP). Kaplan-Meier curves using array and QM-MSP values.
Figure 4A: CpG loci associated with high rate of recurrence in ER+ and ER− breast cancer
Figure 4B: CpG loci associated with high rate of recurrence in ER-negative breast cancer
Figure 4C: Translation from array to QM-MSP for AKR1B1

