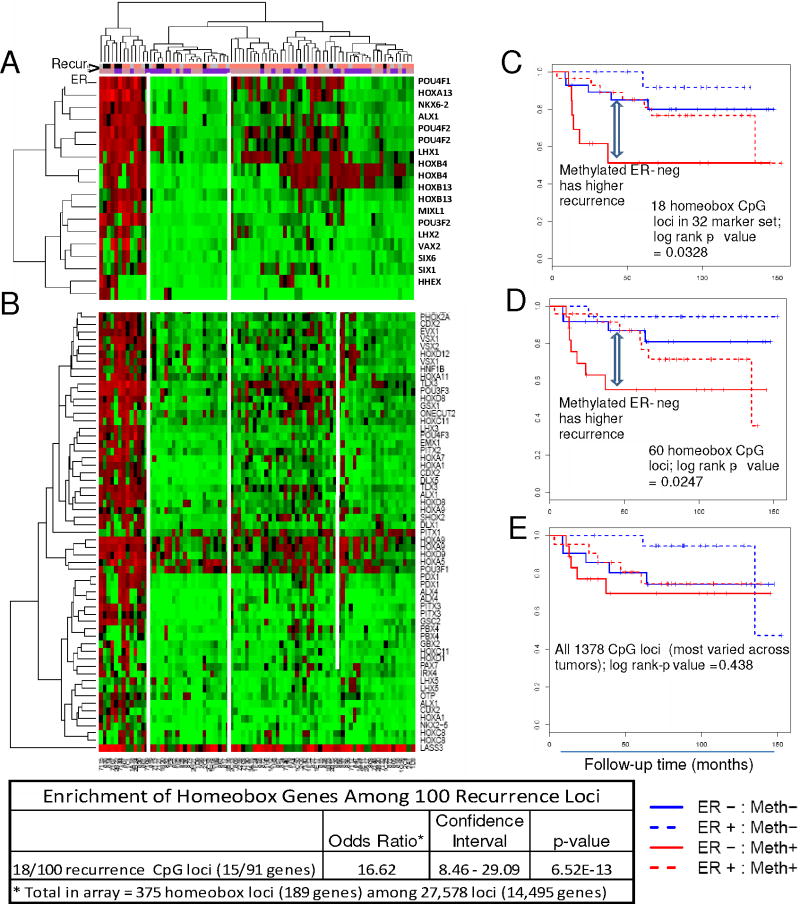
Figure 5.
2-D Hierarchical cluster analysis of CpG loci in homeobox genes. Methylation levels of homeobox (A) 18 loci from the 100 recurrence markers; and (B) 60 additional unique loci in 82 primary invasive tumors. Kaplan-Meier plots of homeobox (C) 18 loci set, log rank p-value=0.033, (D) 60 loci set, p-value=0.025, and (E) unsupervised top 5% most varied array probes across tumor samples, p-value=0.438. Strong enrichment of homeobox genes was observed within the 100 recurrence loci set (table). The bars under the case dendrogram indicate recurrence (black, recurred < 60 mo; salmon, did not recur by 60 mo; gray, censored by 60 mo) and ER (pink, ER-positive; purple ER-negative) status.
Analysis of methylation array homeobox gene loci in primary invasive tumors (n=82)

