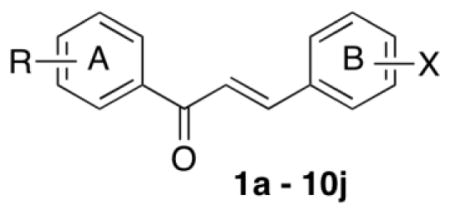
Table 1.
PSA mRNA level of LNCaP cells treated with the corresponding chalcone*

| ||||||||||
|---|---|---|---|---|---|---|---|---|---|---|
| No. | 1 | 2 | 3 | 4 | 5 | 6 | 7 | 8 | 9 | 10 |
| a | 0.78 | 0.13 | 0.41 | 0.44 | 0.14 | 0.24 | 0.21 | 0.64 | 0.67 | 0.61 |
| b | 0.37 | 0.05 | 0.09 | 0.52 | 0.06 | 0.10 | 0.08 | 0.09 | 0.31 | 0.26 |
| c | 0.43 | 0.32 | 0.67 | 0.59 | 0.30 | 0.21 | 0.21 | 0.38 | 0.58 | 0.36 |
| d | 0.68 | 0.46 | 0.56 | 0.71 | 0.22 | 0.35 | 0.32 | 0.43 | 0.71 | 0.71 |
| e | 0.63 | 0.35 | 0.36 | 0.51 | 0.44 | 0.33 | 0.30 | 0.39 | 0.34 | 0.29 |
| f | 0.81 | 0.13 | 0.29 | 0.27 | 0.29 | 0.15 | 0.10 | 0.19 | 0.32 | 0.35 |
| g | 0.47 | 0.23 | 0.48 | 0.44 | 0.16 | 0.11 | 0.33 | 0.24 | 0.24 | 0.18 |
| h | 0.74 | 0.40 | 0.20 | 0.20 | 0.31 | 0.16 | 0.06 | 0.75 | 0.81 | 0.15 |
| i | 0.52 | 0.31 | 0.48 | 1.61 | 0.26 | 0.80 | 0.20 | 0.40 | 0.60 | 0.51 |
| j | 0.50 | 0.48 | 0.19 | 0.62 | 0.23 | 0.16 | 0.16 | 0.36 | 0.35 | 0.30 |
PSA mRNA level was measured in LNCaP cells treated with the corresponding compound at 2.5 μM for 20 hr using real time RT-PCR. The PSA mRNA level is relative to DMSO-treated control cells in which PSA mRNA level is 1 (mean values, n = 3).
