Figure 4.
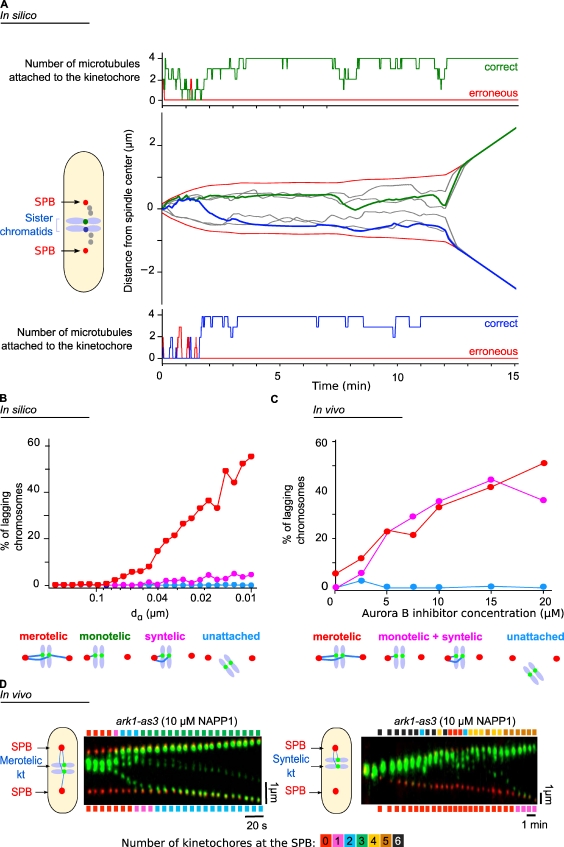
Comparison of in silico and in vivo abnormal chromosome segregation behaviors in the case of Aurora B inhibition. (A) Simulations of the dynamics of the SPBs (black) and the three kinetochore pairs (gray and green/blue). In the center plot, the trajectories of the SPBs and innerkinetochores are shown during the interval from phase 1 (t = 0) to phase 3 (anaphase B). In the top and bottom plots, the occupancy of the ktMT attachment sites is indicated for two sister kinetochores (green in the top plot corresponding to the green kinetochore and blue in the bottom plot corresponding to the blue kinetochore). The red lines indicate the number of erroneous attachments, and the green/blue lines indicate the number of correct attachment. (B) Statistical analysis of the different chromosome attachment defects predicted by the model in silico when the Aurora B–like effect is reduced. (C) Quantification of the different types of attachment defects seen in vivo in the presence of increasing amounts of the inhibitor 1NAPP1. (D) Kymograph representations of the movements of the SPBs (Cdc11-cfp, red) and the kinetochores (kt; Ndc80-GFP, green) in a cell bearing an ATP analogue-sensitive mutation in the Aurora kinase gene, showing a stretched merotelic attachment (left) or syntelic attachment (right). The color bars above (and below) the kymographs give the number of kinetochores that have reached the upper (or lower) SPB at a given time, and the color code is detailed on the scale below the two kymographs.

