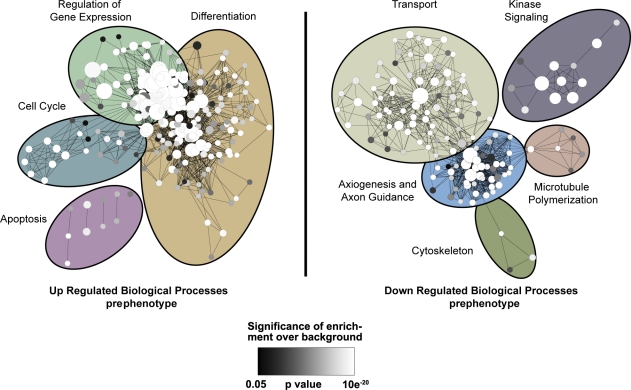
Figure 1.
GO enrichment map of biological processes altered in prephenotype dt27J mice. mRNA expression profiling of P4 WT (n = 3) and dt27J (n = 3) DRGs. Genes were clustered based on GO term, and an enrichment map of those biological processes up-regulated (left) or down-regulated (right) in prephenotype dt27J DRGs relative to WT littermates is depicted. Each node represents one GO term. The node size represents the number of genes clustered to each GO term, node color reflects the significance of the enrichment above the background of the entire mouse genome (white shows most significant, and black shows least significant; significance cut is P < 0.05, Fisher’s exact test), and edge length reflects the similarity between GO terms. Clusters of functionally related gene sets were manually circled and assigned a label representative of the overall biological process. The most significantly down-regulated biological process in prephenotype dt27J DRGs is transport.

