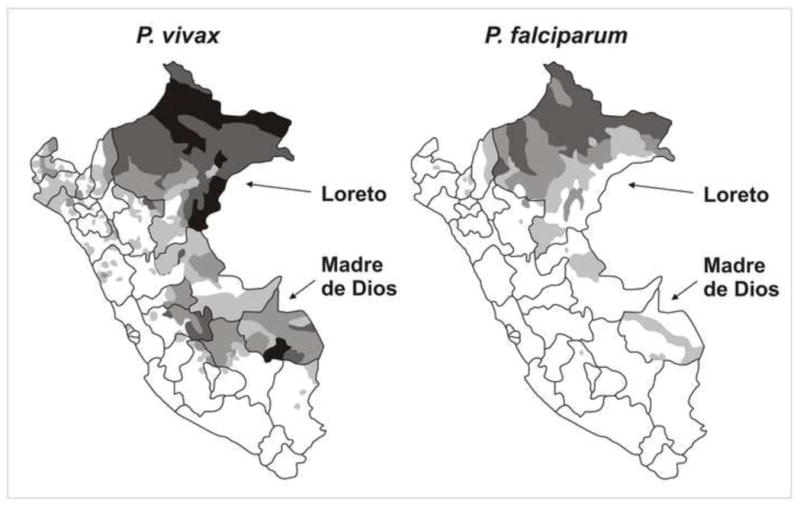
Figure 3.

Map of Peru showing the areas with highest levels of malaria transmission, the Departments of Loreto (where one of our field sites is located) and Madre de Dios (where our second Peruvian field site is located). The different shadding patterns (as in Figure 1) reflect different transmission levels in 2008. Source of data: Ministry of Health of Peru, 2009.
