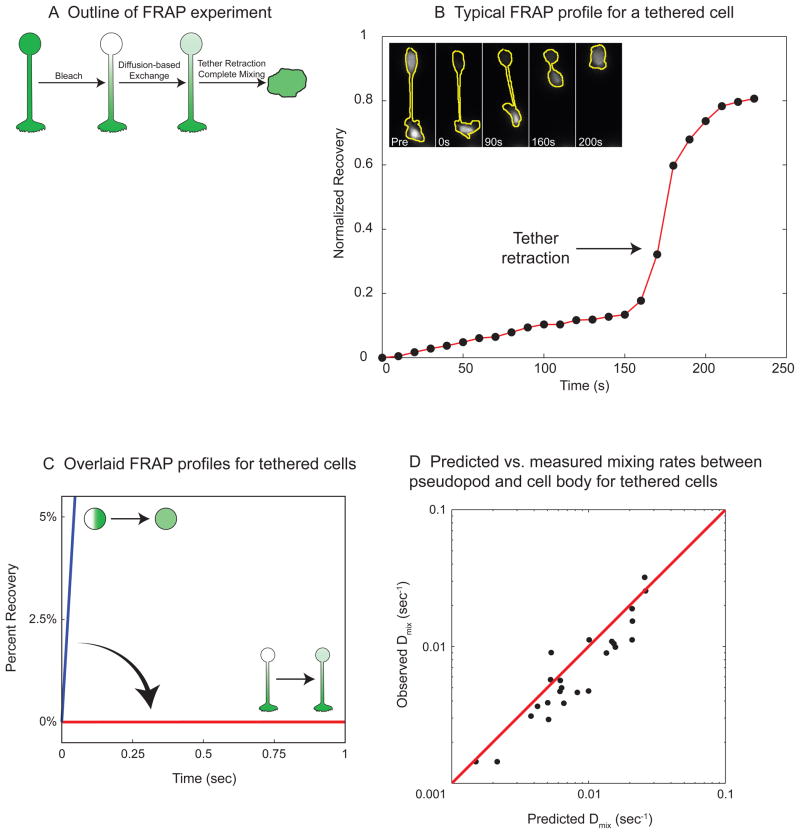
Figure 4. The tethered morphology dramatically attenuates diffusion.
A) Outline of FRAP (Fluorescence Recovery After Photobleaching) experiment. A GFP-expressing HL-60 cell is heated to generate a tethered pseudopod. We bleached the GFP in the cell body, and the recovery in the cell body was measured to monitor diffusion-based mixing through the tether. Retraction of the pseudopod causes the contents of the cell body and the pseudopod to mix completely.
B) Typical FRAP profile for a tethered cell. The graph shows the normalized fluorescence recovery due to diffusion for the cell whose GFP fluorescence is shown in the inset images (with cell outlines in yellow). There is slow linear recovery until 160 sec, when the tethered pseudopod retracts, and the GFP from the pseudopod rapidly mixes with the cell body.
C) Overlaid FRAP profiles for tethered cells. The measured fluorescence recoveries for all of the tethered cells during the first second after bleaching are overlaid in red. The expected initial fluorescence recovery for a non-tethered spherical cell (mixing rate constant = 1.2/sec) is shown in blue.
D) Predicted vs. measured mixing rates between pseudopod and cell body for tethered cells. Each black dot represents the diffusion-based mixing rate constant for an individual photobleached cell. The y coordinate for each cell is the experimentally measured mixing rate constant (Dmix, obs). The x coordinate for each cell is the predicted mixing rate constant using the formula: ; where Dmix,pred is the predicted mixing rate constant; DGFP is the known diffusion coefficient of GFP in cytoplasm (27μm2/s, (Swaminathan et al., 1997)); L is the tether length; and Vcell and Vtether are the volumes of the cell and the tether, respectively. The values L, Vcell and Vtether were measured for each cell from brightfield images. The predicted mixing rates correlate with the measured values (R2 = 0.8, N=24, red line is y = x). The tethered geometry reduces mixing rate by 134 - 4472 fold for all of the cells in the experiment.

