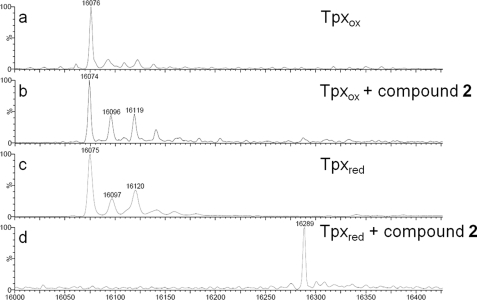
FIGURE 3.
Deconvoluted ESI-MS spectra of Tpx after reaction with compound 2. Tpx was incubated with compound 2 in the absence (Tpxox) or presence of T(SH)2 (Tpxred) and subjected to ESI-MS analysis. a, oxidized Tpx. The peak at 16,076 Da corresponds to the calculated mass (16,074.2 Da) of the full-length tag-free protein with an artificial N-terminal GAG tripeptide. b, oxidized Tpx incubated with compound 2. No mass shift was observed. c, reduced Tpx. d, reduced Tpx incubated with compound 2 showed a new peak at 16,289 Da. The mass increase by 214 Da corresponds to Tpx modified by compound 2 after elimination of HCl (expected mass difference 213 Da). The peaks at 16,096 (16,097) Da and 16,119 (16,120) Da with 23 and 45 Da higher masses probably represent mono- and di-sodium adducts of Tpx. The accuracy of the measurement was ± 2 Da.

