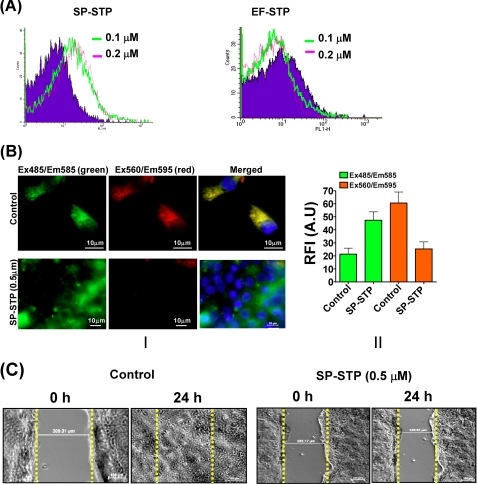
FIGURE 4.
Biochemical basis of SP-STP-mediated apoptosis of Detroit 562 cells. A, flow cytometric analysis of the annexin-V-FITC-stained SP-STP and EF-STP treated (at indicated concentrations) pharyngeal cells. Ten thousand events were counted, and the shift in the FL-1 quadrant in comparison with the untreated cells was taken as reference to calculate percentage of apoptotic cells. B, effect of SP-STP treatment on the mitochondrial membrane potential (Ψm). Panel I, upper row shows JC-1-stained control cells showing green, red orange, and merged yellow fluorescent aggregates. The lower panel shows SP-STP-treated cells showing diffused green fluorescence dispersed throughout the cytoplasm with minimal red orange fluorescent aggregates. Panel II, quantitative assessment as measured by the ratio of red versus green (hyperpolarized versus depolarized) fluorescence in the untreated versus the SP-STP-treated (0.5 μm, 24 h) pharyngeal cells. A.U., arbitrary units. C, in vitro wound healing scratch assay showing the extent of cell migration and closing of the wound (distance in micrometers in untreated (control) and SP-STP treated (0.5 μm, 24 h) pharyngeal cells within 24 h.

