FIGURE 2.
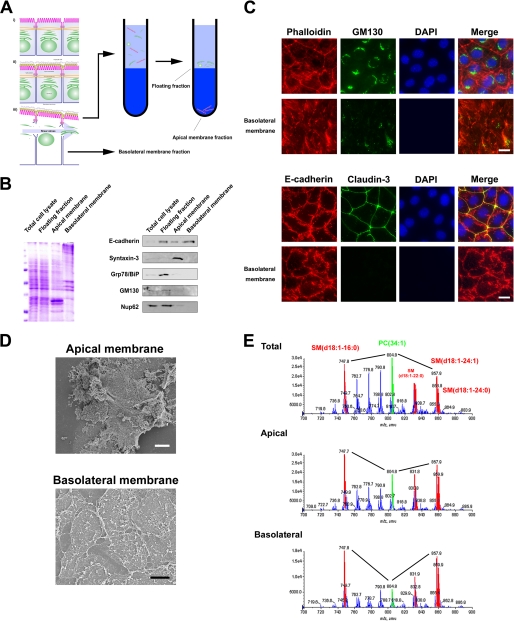
MS profiling of PC and SM molecular species in the apical and basolateral membranes. A, shown is the scheme of apical and basolateral membrane isolation for epithelial cell monolayers cultured in dishes. For details, see “Experimental Procedures.” B, shown is an immunoblot analysis of the apical membrane fraction, basolateral membrane fraction, and floating fraction. 5 μg of each membrane fraction was separated by SDS-PAGE (Coomassie Brilliant Blue staining in the left panel), transferred to nitrocellulose membranes, and probed with antibodies against the indicated marker proteins (right panel). The results are representative of three independent experiments. C, intact EpH4 cells and basolateral membrane were fixed and stained with the indicated antibodies. Note that signals of GM130/DAPI/claudin-3 were little observed in the basolateral membrane (scale bar, 10 μm). D, shown is scanning electron micrographs of isolated apical and basolateral membranes (white bar, 1 μm; black bar, 3 μm). E, shown are negative ion mass spectra of the m/z range 500–1000 of lipid extracts prepared from the apical and basolateral membranes. The peak assignment to sphingomyelin molecular species is indicated (red). Compared with the amount of phosphatidylcholine (34:1), sphingomyelin (d18:1–16:0) and sphingomyelin (d18:1–24:1) were enriched in both the apical membrane and basolateral membrane. For additional peak assignments, see “Results.” The total carbon chain length (x) and number of carbon-carbon double bonds (y) of individual lipid molecular species are specified as (x:y). The results are representative of three independent experiments.

