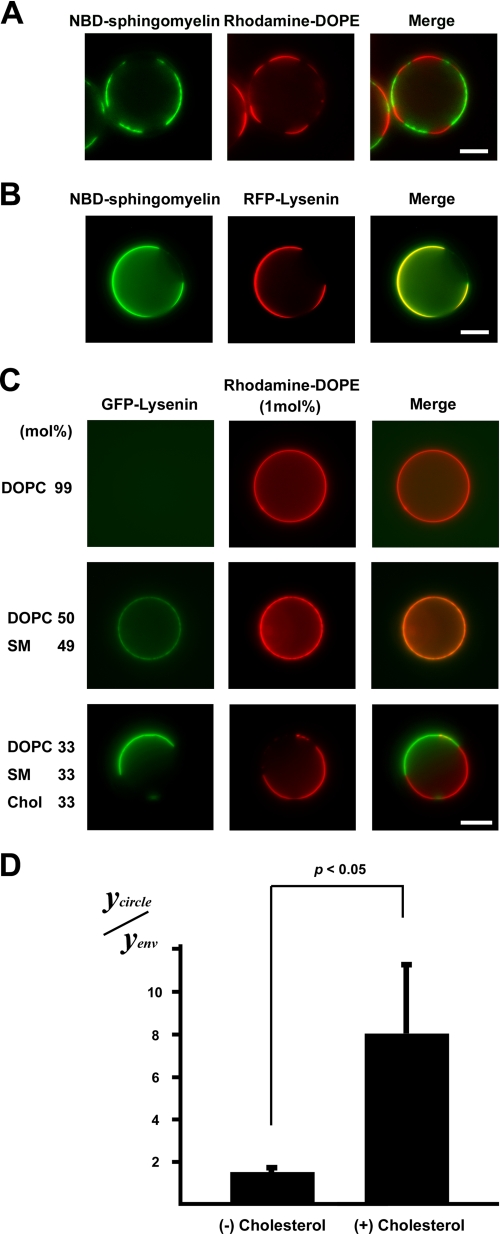
FIGURE 3.
Binding of lysenin to sphingomyelin-containing GUVs. A, shown is the observation of a GUV containing 5 mol% NBD-sphingomyelin (green) (NBD-C12-SM/DOPC/SM(d18:1–16:0)/cholesterol 6:33:27:33) and RFP-lysenin (red) (scale bar, 10 μm). B, shown is the observation of binding of GFP-lysenin (green) to a GUV of DOPC/rhodamine-DOPE (molar ratio, 99:1) (upper panel), SM (d18:1–16:0)/DOPC/rhodamine-DOPE (molar ratio, 49:50:1) (middle panel), or SM(d18:1–16:0)/DOPC/cholesterol/rhodamine-DOPE (molar ratio, 33:33:33:1) (lower panel). Each GUV contained 1 mol% rhodamine-DOPE (scale bar, 10 μm). C, the fluorescence of GFP-lysenin associated with liposome (Ycircle) and the fluorescence of GFP-lysenin outside of the liposome (Yenv) were quantitatively measured in each GUV. The value of Ycircle/Yenv of the SM(d18:1- 16:0)/DOPC/cholesterol (Chol)/rhodamine-DOPE (molar ratio, 33:33:33:1) and SM (d18:1–16:0)/DOPC/rhodamine-DOPE (molar ratio, 49:50:1) GUVs was calculated. Data are the means ± S.D. of three independent experiments. p < 0.05 by Student's t test.

