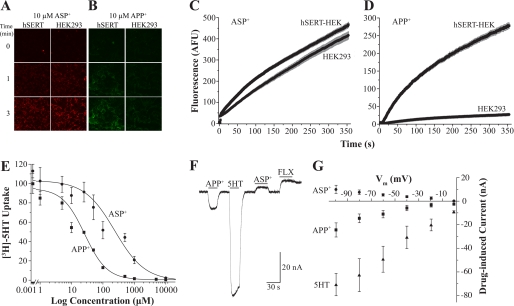
FIGURE 4.
Comparing the effects of ASP+ and APP+ on hSERT. A and B, images of hSERT-HEK or parental HEK293 cells before (row labeled with 0) and after exposure to 10 μm ASP+ (A) or APP+ (B) for 1 or 3 min. ASP+ fluoresces red and labels the exterior membrane of cells in both hSERT-HEK and parental cells, whereas APP+, which fluoresces green, seems to accumulate only inside of hSERT-HEK cells. C and D, time-lapses comparing fluorescence accumulation rates between hSERT-HEK and HEK293 cells for ASP+ (30 μm; C) and APP+ (5 μm;D). E, concentration-response curve for APP+ and ASP+ inhibition of [3H]5HT uptake into hSERT-HEK cells. [3H]5HT accumulation was measured in hSERT-HEK cells in the presence of increasing APP+ and ASP+ concentrations and normalized to data in the absence of the competing substrate. The data were fit to the Hill equation, y = Vmax + (V0 − Vmax) × xn/(kn + xn), and ki values were determined using the Cheng-Prusoff equation to correct for substrate concentration. The fits yield ki (APP+) = 19.7 ± 2.23 μm and ki (ASP+) = 180.1 ± 20.3 μm. Values are represented as means ± S.E. (n = 3). The Hill coefficients for ASP+ and APP+ are 0.91 ± 0.15 and 1.23 ± 0.08, respectively. F, electrophysiological effect of substrates on hSERT. Currents in an hSERT-expressing X. laevis oocyte clamped to −60 mV are measured in response to 10 μm 5HT, APP+, ASP+, and 1 μm fluoxetine (FLX). Bars display perfusion duration of each compound. G, the effect of voltage (from 0 to −100 mV) on hSERT-induced currents. Currents induced by 5HT, APP+, ASP+ are plotted relative to the baseline set as 0 at each potential (n = 4). Control (uninjected) oocytes show no response to 5HT, ASP+, or APP+ (not shown).

