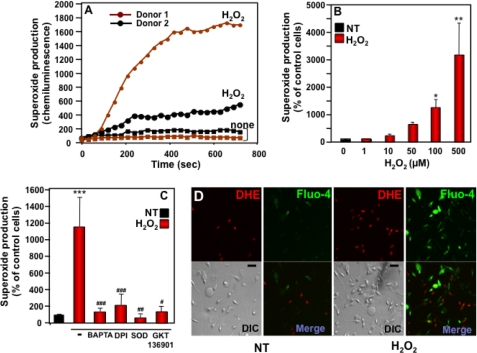
FIGURE 3.
Dose- and time-dependent effects of H2O2 on superoxide generation by human spermatozoa. A, superoxide produced by spermatozoa from two different donors with or without 100 μm H2O2 was measured over the indicated time course. These results are representative of the range of superoxide responses observed among a total of 94 sperm donors. B, superoxide production was measured in sperm cells stimulated for 10 min with various concentrations of H2O2 (0–500 μm). C, superoxide production stimulated with 100 μm H2O2 was determined in sperm cells preincubated with BAPTA (100 μm), DPI (10 μm), SOD (400 units/ml), or GKT136901 (0.5 μm). Superoxide production was determined as described in the legend to Fig. 2 and expressed as a percent of non-treated cells (NT). The data expressed in panels B and C are the mean ± S.E. of 6–10 independent experiments. Asterisks indicate statistical significance versus control cells without H2O2. *, p < 0.05; **, p < 0.01; ***, p < 0.001, and number signs indicate statistical significance versus cells stimulated with H2O2. #, p < 0.05; ##, p < 0.01; ###, p < 0.001. D, confocal images of spermatozoa incubated for 10 min without (NT) or with H2O2 were recorded using a Zeiss microscope. Each set of four photomicrograph panels corresponds to superoxide production (red fluorescence, top left), Ca2+ influx (green fluorescence, top right), the differential interference contrast (DIC) image (bottom left), and a merge picture of the two fluorescent images (bottom right). The scale bar indicates a size of 10 μm. DHE, dihydroethidine.

