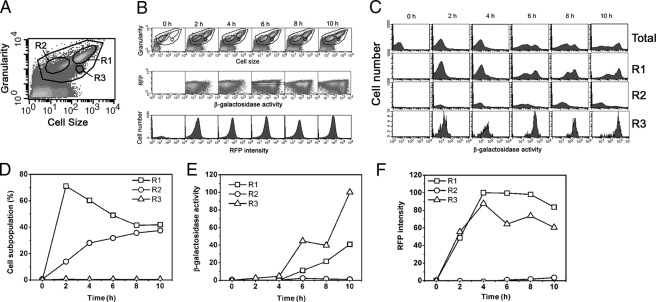
FIGURE 2.
The in vivo β-galactosidase activities of the recombinant fusion protein detected by flow cytometry. A, three population cells induced by IPTG. The recombinant cells were induced by 0.5 mm IPTG at 37 °C for 2 h. The cell size (reflected by forward scattering light) and granularity (reflected by side scattering light) of individual E. coli cells were analyzed, and three cell populations (R1, R2, and R3) were identified. The three cell populations existed between 2 and 10 h (see B). B, R1 region cells. The recombinant cells were induced by 0.5 mm IPTG at 37 °C for designated times. Top row, three dominant cell populations (R1, R2, and R3) in dot plots were characterized. Middle row, RFP fluorescence intensities versus β-galactosidase activities in R1 region were shown in dot plots. Bottom row, RFP fluorescence intensities in R1 regions were demonstrated in histogram plots. C, β-galactosidase activities of the total and three populations demonstrated in flow cytometric histogram plots. D, the percentages of R1, R2, and R3 cell populations during the cell culturing in IPTG-containing medium. The culturing conditions were the same as in B. The percentages of each population were calculated on the base that the three populations were 100% at any time. E, the β-galactosidase activities of the three cell populations. F, RFP intensities of the three cell populations.

