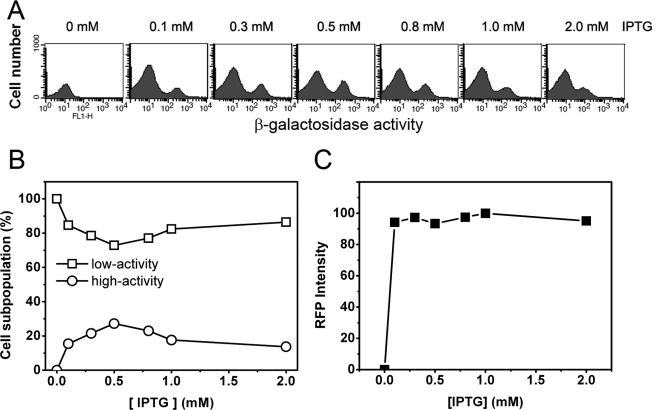
FIGURE 4.
Effects of IPTG concentrations on the percentages of two β-galactosidase activity populations in the R1 region. A, the β-galactosidase activity distribution identified by FL1 (green fluorescence) using flow cytometry. B, the percentages of two β-galactosidase activity populations. C, the red fluorescence intensities of the R1 region cells. The cells were cultured for 5.5 h.

