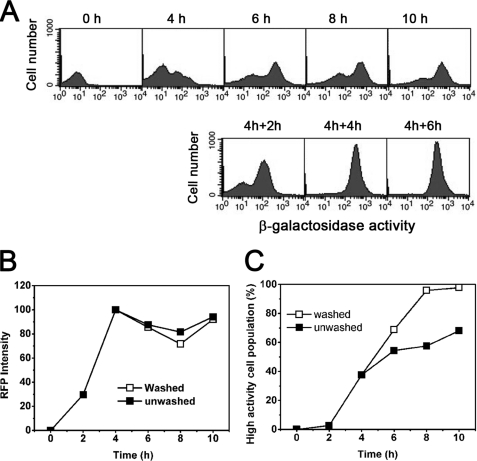
FIGURE 5.
Effects of IPTG removal after being induced for 4 h on the percentages of two β-galactosidase activity populations in the R1. A, the β-galactosidase activity distribution without IPTG removal (top row) or when IPTG was removed (bottom row). B, RFP intensity. C, the percentages of high activity populations.

