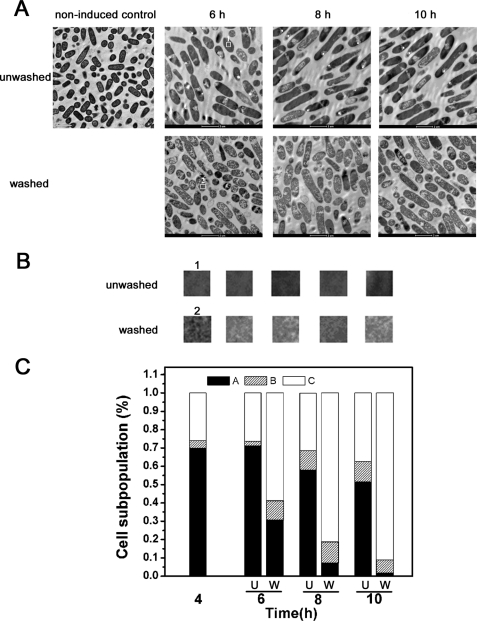
FIGURE 7.
Effects of IPTG removal on the percentages of non-inclusion body cells indentified by transmission electron microscopy. A, the noninduced and IPTG-induced cells, as well as the cells first induced with IPTG for 4 h and then cultured in IPTG-free medium for the designated times, prepared and observed by transmission electron microscopy. B, the detailed morphological difference of the featureless areas of the cells continually cultured in IPTG-containing medium and the cells first induced with IPTG for 4 h and then cultured in IPTG-free medium. The featureless areas were purposely selected (for example areas 1 and 2) from A of this figure and amplified six times. White materials were clearly notable in the featureless areas of washed cells. C, the percentages of the cells with the following features: IB-containing accompanied with darkness in the rest of the large area (black bars, A), IB-bearing and loose white material-dominated (hatched bars, B), and IB-free and loose white material-dominated (white bars, C). The completely dark, small and hollow cells were not counted. At least 200 cells were counted for each bar from randomly selected microscopic photographs. U, unwashed; W, washed.

