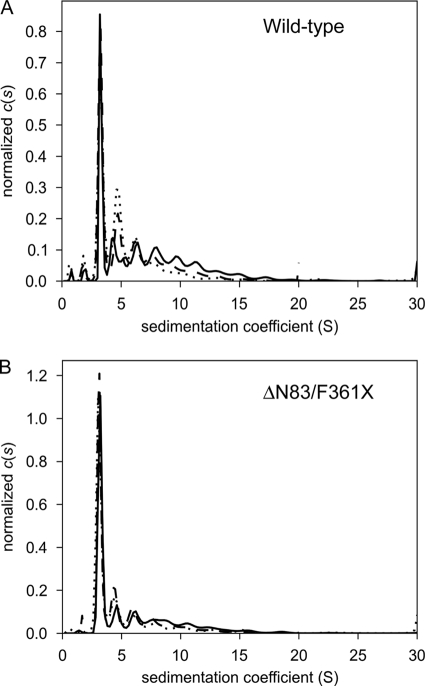
FIGURE 1.
Size distributions of wild-type and ΔN83/F361X SUMO-BDP. Size c(s) distributions are shown for three different concentrations: low (dotted lines), medium (dashed lines), and high (solid lines); see below for concentration values. The distributions were normalized by the total signal present between 2 and 20 S. A, wild-type SUMO-BDP (low = 4.0 μm, medium = 11.5 μm, high = 35 μm); B, ΔN83/F361X SUMO-BDP (low = 5.7 μm, medium = 16 μm, high = 49 μm).

