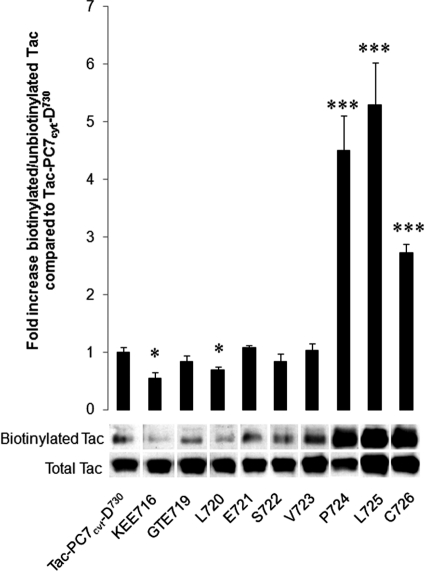
FIGURE 7.
Surface biotinylation assay. CHO-K1 cells transfected with the same constructs as in Fig. 6. Surface molecules were biotinylated with sulfo-NHS-LC-biotin, and the ratio of biotinylated/unbiotinylated Tac chimeras was determined by Western blot analysis. A representative figure of this Western blot analysis is shown. Quantification of biotinylated and unbiotinylated Tac chimeras was performed using the Image Station 440 (Kodak Digital Science). Statistical analysis was performed using the Student's t test. Values were considered to be significantly different from Tac-PC7cyt-D730 when p value < 0.05. *, p value < 0.05, ***, p value < 0.001. Error bars indicate S.D.

