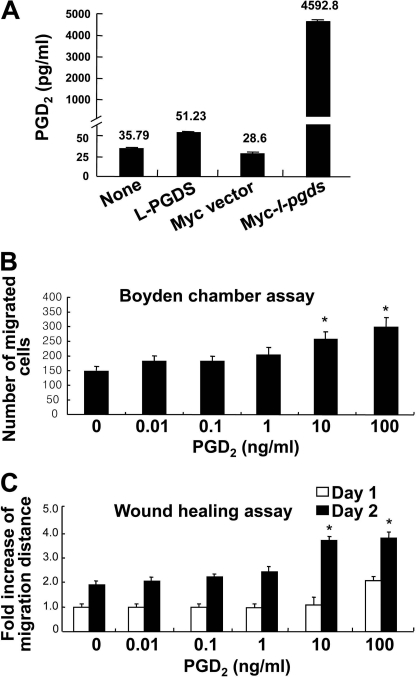
FIGURE 8.
Effects of L-PGDS treatment on the production of PGD2. NIH3T3 fibroblast cells were either transfected with L-pgds cDNA or treated with L-PGDS protein (100 ng/ml) for 24 h. Concentrations of PGD2 in medium were measured by PGD2 electroimmunoassay (A). The results are the mean ± S.D. (n = 3). NIH3T3 fibroblast cells were treated with different concentrations of PGD2, and then either the Boyden chamber assay (B) or the wound healing assay (C) was done to evaluate cell migration. The quantification of cell migration was done as described above. The results are the mean ± S.D. (n = 3). *, p < 0.05; compared with the untreated control at the same time point.

