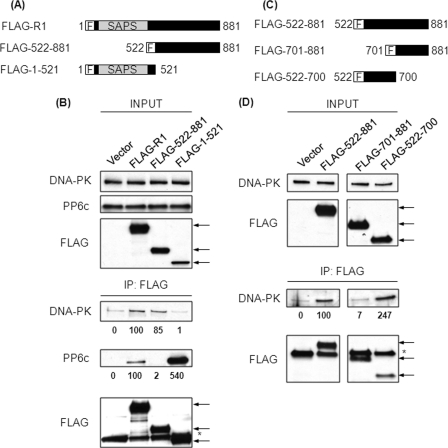
FIGURE 3.
Residues 522–700 of R1 are sufficient for binding DNA-PK. A, schematic representation of the FLAG-tagged constructs of R1 used. F, N-terminal FLAG tag. B, 293T cells were transfected with empty plasmid or plasmids encoding the FLAG-tagged proteins described in A. Forty-eight hours post-transfection, FLAG-tagged proteins were immunoprecipitated (IP) from the lysates of these cells using anti-FLAG antibody. The levels of input proteins (top three panels) and immunoprecipitated proteins (bottom three panels) were determined by Western blotting with the indicated antibodies. The arrows indicate the position of FLAG-tagged proteins. The asterisk indicates the migration of the antibody heavy chain. The relative amount of coprecipitated DNA-PK and PP6c was quantified by densitometric analysis and compared with the amount of these proteins coprecipitated from cells transfected with FLAG-R1 (second lane). Values below the Western blot analysis are mean ± S.D. from three independent experiments. For DNA-PK binding to FLAG-522–881, difference not significant and for FLAG-1–521, p < 0.05; for PP6c binding to FLAG-522–881, p < 0.001 and for FLAG-1–521, p < 0.05. C, schematic representation of the FLAG-tagged constructs of R1 used. F, N-terminal FLAG tag. D, 293T cells were transfected with empty plasmid or plasmids encoding the FLAG-tagged proteins described in C. Forty-eight hours post-transfection, FLAG-tagged proteins were immunoprecipitated from the lysates of these cells using anti-FLAG antibody. The levels of input proteins (top two panels) and immunoprecipitated proteins (bottom two panels) were determined by Western blotting with the indicated antibodies. The arrows indicate the position of FLAG-tagged proteins. The asterisk indicates the migration of antibody heavy chain. The relative amount of coprecipitated DNA-PK was quantified by densitometric analysis and compared with the amount of DNA-PK coprecipitated from cells transfected with FLAG-522–881 (second lane). Values below the Western blot analysis are mean ± S.D. from three independent experiments. For FLAG-701–881, p < 0.05 and for FLAG-522–881, p < 0.05.

