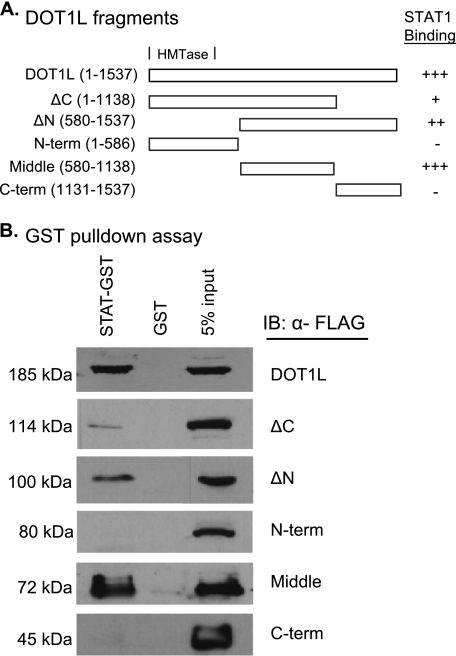
FIGURE 5.
Mapping of the DOT1L region that interacts with STAT1 in GST pulldown assays. A, graphic depiction of the DOT1L fragments and their relative STAT1 binding affinities. The presence (+) or absence (−) of an interaction is shown, with +, ++, and +++ indicating weak, modest, and strong interactions, respectively. N-term, N-terminal; C-term, C-terminal. B, GST pulldown assays using whole extracts prepared from 2fTGH cells transiently transfected with pcDNA3β FLAG-tagged DOT1L or FLAG-tagged DOT1L fragment vectors and then immunoblotted (IB) with α-FLAG. A 5% input aliquot of the extracts was included for reference.

