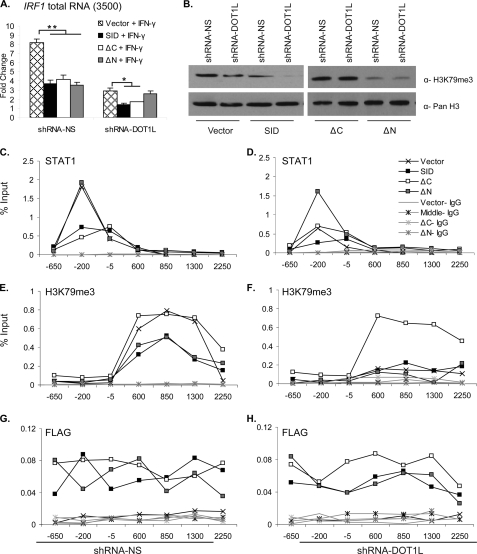
FIGURE 6.
Overexpression of the SID of DOT1L represses IRF1 gene expression and alters STAT1 binding. A, qRT-PCR measured IRF1 mRNA expression in 2fTGH, shRNAmir non-silencing (shRNA-NS), and shRNAmir-DOT1L (shRNA-DOT1L) cell lines that were transiently transfected with pcDNA3.0 DOT1L SID, ΔC, ΔN, or empty vector. IFN-γ induction was for 30 min. IRF1 was normalized to GAPDH, and expression is presented as -fold change relative to the uninduced, shRNAmir-NS cell line transfected with empty vector. Error bars indicate S.E. (n = 2). Student's t test determined significance, **, p ≤ 0.01, *, p ≤ 0.05. B, Western blots of acid-extracted histones from the shRNAmir non-silencing and shRNAmir-DOT1L cell lines that were transiently transfected as in panel A. PanH3 served as a loading control. C–H, ChIP, using the indicated antibodies in shRNAmir-DOT1L (right panels) or shRNAmir non-silencing (left panels) cells transiently transfected with pcDNA3.0 DOTL1 SID, ΔC, ΔN, or empty vector and treated with IFN-γ for 30 min. p ≤ 0.05 for black lines with an X or gray squares versus black lines with black squares or white squares in panel C; black lines with gray squares versus others in panel D; black lines with an X or white squares versus black lines with black squares or gray squares in panel E; black lines with white squares versus others in panel F.

