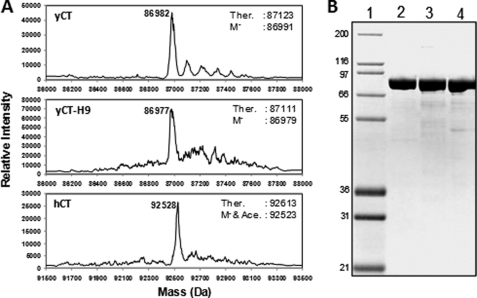
FIGURE 3.
Analysis of recombinant protein reagents. A, shown are mass spectra of HPLC-purified recombinant proteins. Labels at the peak indicate the observed mass of the protein in daltons. Ther. indicates the theoretical mass of the protein in daltons. M− indicates the theoretical mass of the demethylated protein. M− & Ace. indicates the theoretical mass of demethylated and singly acetylated protein. B, Coomassie-stained SDS-10% PAGE analysis of the purified CT-domain proteins. Lane 1, molecular weight protein markers (Marker12, Invitrogen); lane 2, yCT purified; Lane 3, hCT purified; lane 4, yCT-H9 purified. Mass of the protein markers (in kDa) shown on the left. Each lane contained 2 μg of recombinant protein.

