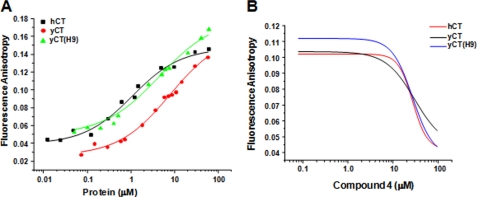
FIGURE 4.
The inhibition of the CT domain variants. A, shown is a plot of the fluorescence anisotropy of compound 1 as a function of protein concentration. B, the fluorescence anisotropy of compound 1 as a function of the concentration of compound 4 is shown. The data from one representative of several duplicate runs are shown. The kd values calculated from these curves (A and B) were given in Table 2.

