FIGURE 2.
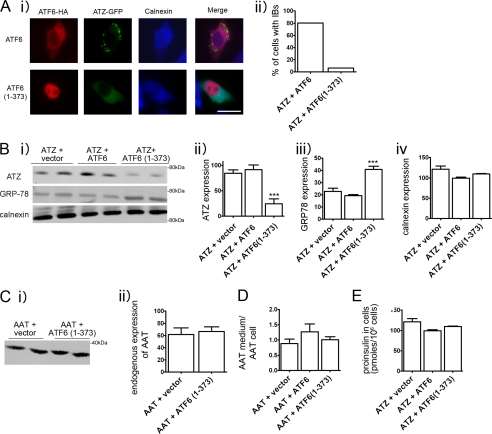
Expression of ATF6(1–373) reduces expression of ATZ and formation of IBs. A, panel i, cells were transiently transfected with ATZ-pEGFP-N2 and ATF6-HA-pCGN or with ATZ-pEGFP-N2 and ATF6(1–373)-HA-pCGN and analyzed by immunofluorescence. Cells were stained with primary rat monoclonal antibodies against the HA tag and rabbit polyclonal antibodies against calnexin. Secondary antibody staining was carried out using Cy3-conjugated anti-rat antibodies and Cy5-conjugated anti-rabbit antibodies. Panel ii, quantification of cells with IBs. For the quantification shown in the graph, we measured the percentage of cells that had at least one IB. Averages were obtained from the experiment shown in panel i (n = 30 cells per time point). Bar, 25 μm. B, panel i, Hepa 1-6 cells were transiently transfected with ATZ-pEGFP-N2 and empty vector, ATZ-pEGFP-N2 and ATF6-HA-pCGN, or ATZ-pEGFP-N2 and ATF6(1–373)-HA-pCGN as indicated. Cell lysates were analyzed by Western blot 48 h after transfection using the indicated antibodies. Panels ii–iv, ATZ-GFP, GRP78/BiP, and calnexin expression levels from the experiment in panel i were measured by densitometry. C, panel i, Hepa 1-6 cells were transiently transfected with either ATF6-HA-pCGN or ATF6(1–373)-HA-pCGN. Endogenous AAT expression was analyzed by Western blot. Panel ii, endogenous AAT levels were measured by densitometry. D, Hepa 1-6 cells were co-transfected with AAT-pcDNA3.1 and empty vector, AAT-pcDNA3.1 and ATF6-HA-pCGN, or AAT-pcDNA3.1 and ATF6(1–373)-HA-pCGN as indicated. Data are expressed as the ratio exogenous AAT in the medium/exogenous AAT in cell lysates. E, proinsulin levels in Hepa 1-6 cells co-transfected with ATZ-pEGFP-N2, proinsulin-pcDNA3.1, and empty vector; ATZ-pEGFP-N2, proinsulin-pcDNA3.1, and ATF6-HA-pCGN; or ATZ-pEGFP-N2, proinsulin-pcDNA3.1, and ATF6(1–373)-HA-pCGN. Statistical significance is indicated by *** (p ≤ 0.0001). Error bars = standard deviation derived from 3 independent experiments.

