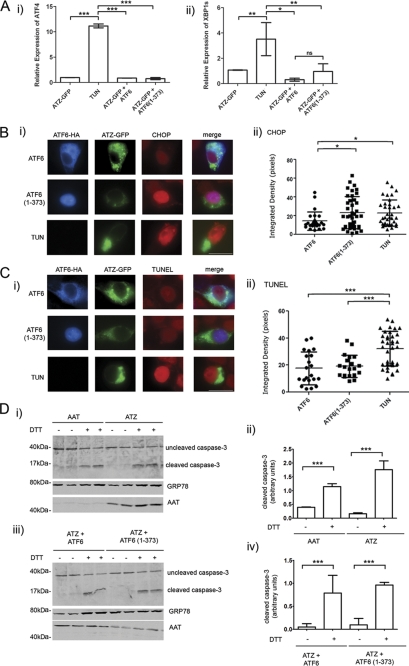
FIGURE 8.
ATF6(1–373) expression does not induce XBP1 and ATF4 or promote apoptosis. A, Hepa 1-6 cells were transiently transfected with ATZ-pEGFP-N2 and either ATF6-HA-pCGN or ATF6(1–373)-HA-pCGN. As a positive control for ER stress, cells were treated for 16 h with 1 μg/ml of tunicamycin (TUN). ATF4 (panel i) and XBP1s (panel ii) mRNA induction was measured by quantitative real time PCR 48 h after transfection. Each sample was normalized for β-actin mRNA (for each condition, n = 3). Error bars = standard deviations derived from 3 independent experiments. B, panel i, Hepa 1-6 cells were co-transfected with ATZ-pEGFP-N2 and either ATF6-HA-pCGN or ATF6(1–373)-HA-pCGN for 48 h. As a positive control, Hepa 1-6 cells were transfected with ATZ-pEGFP-N2 and treated for 16 h with 1 μg/ml tunicamycin (TUN). Cells were analyzed by immunofluorescence using rat monoclonal antibody against HA and rabbit polyclonal antibody against CHOP. Secondary staining was carried out using Cy3-conjugated anti-rat antibodies and Cy5-conjugated anti-rabbit antibodies. Panel ii, quantification of the experiment shown in panel i (ATF6, n = 25; ATF6(1–373), n = 41; tunicamycin, n = 36). C, panel i, Hepa 1-6 cells were co-transfected and treated as in B. The TUNEL assay was performed on fixed cells followed by primary staining using rat monoclonal antibody against HA. Secondary staining was carried out using of Cy5-conjugated anti-rat antibodies. Panel ii, quantification of the experiment shown in panel i (ATF6, n = 24; ATF6(1–373), n = 21; tunicamycin, n = 37). B and C, error bars = standard deviations. D, panel i, Hepa 1-6 cells were transiently transfected with AAT-myc-pcDNA3.1 or ATZ-myc-pcDNA3 and treated with or without 2 mm DTT for 16 h. Western blots were probed with the indicated antibodies. Panel ii, cleaved caspase 3 shown in panel i was measured by densitometry. Panel iii, Hepa 1-6 cells were transiently transfected with ATZ-myc-pcDNA3.1 and ATF6-HA-pCGN or ATZ-myc-pcDNA3.1 and ATF6(1–373)-HA-pCGN. Cells were incubated with or without 2 mm DTT for 16 h. Western blots were probed with the indicated antibodies. Panel iv, cleaved caspase 3 shown in panel iii was measured by densitometry. Statistical significance is indicated by * (p ≤ 0.01), ** (p ≤ 0.001), *** (p ≤ 0.0001), and ns (p > 0.05). Bars, 25 μm. Error bars as in panel A.

