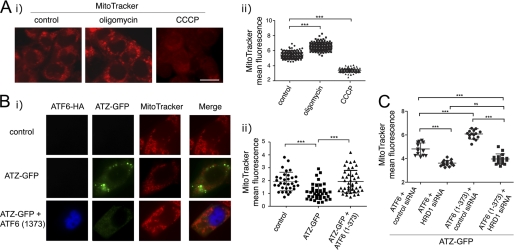
FIGURE 9.
Expression of ATF6(1–373) reduces ATZ-dependent mitochondrial damage. A, panel i, untransfected Hepa 1-6 cells were treated either with 20 μg/ml CCCP or vehicle (DMSO; control) for 2 h or 4 μg/ml oligomycin for 2 h. Mitochondria were stained using MitoTracker Red CMXRos. Cells were fixed and visualized by fluorescence microscopy. Panel ii, quantification of the experiment shown in panel i) (control, n = 187; oligomycin, n = 185; CCCP, n = 186). B, panel i, Hepa 1-6 cells were transiently transfected with Lipofectamine alone (control), ATZ-pEGFP-N2 and empty vector, or ATZ-pEGFP-N2 and ATF6(1–373)-HA-pCGN. After 48 h, mitochondria were stained as in A. Immunofluorescence analysis was done using primary rat monoclonal antibodies against HA. Secondary staining was carried out using Cy5-conjugated anti-rat antibodies. Panel ii, quantification of the MitoTracker fluorescence of the experiment shown in panel i (control, n = 32; ATZ-GFP, n = 36; ATZ-GFP + ATF6(1–373), n = 41). C, panel i, Hepa 1-6 cells were transiently transfected with ATZ-pEGFP-N2, ATF6-HA-pCGN, and control siRNA; ATZ-pEGFP-N2, ATF6-HA-pCGN, and HRD1 siRNA; ATZ-pEGFP-N2, ATF6(1–373)-HA-pCGN, and control siRNA; or ATZ-pEGFP-N2, ATF6(1–373)-HA-pCGN, and HRD1 siRNA. Staining of mitochondria and immunofluorescence microscopy were carried out as in B, and the experiment was quantified (cells transfected with ATF6-HA-pCGN and control siRNA, n = 20; ATF6-HA-pCGN and HRD1 siRNA, n = 20; ATF6(1–373)-HA-pCGN and control siRNA, n = 20; ATF6(1–373)-HA-pCGN and HRD1 siRNA, n = 21). Statistical significance is indicated by *** (p ≤ 0.0001) and ns (p > 0.05). Bars, 25 μm. Error bars = standard deviations.

