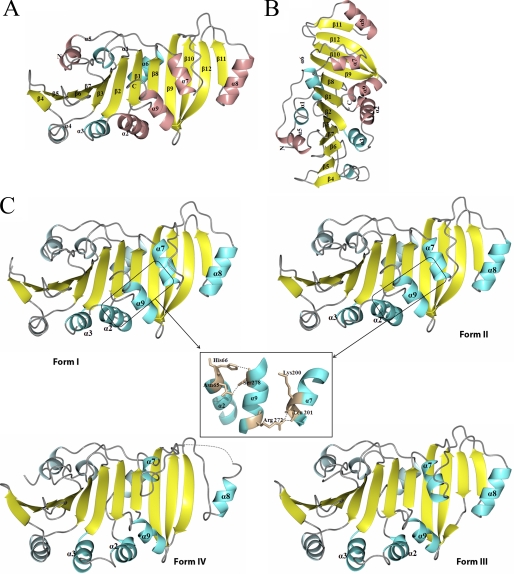
FIGURE 1.
Crystal structures of TP0453. A, shown is the overall structure of TP0453 depicted as a ribbon model in which α helices are shown in cyan or pink, β strands are shown in yellow, and loops are shown in gray. Previously predicted AHs (18) are shown in pink. B, TP0453, shown in A, is rotated by 90° along the z axis. C, the different crystal forms of TP0453 obtained with increasing concentrations of β-OG are shown: Form I (0.1–0.25%), Form II (0.25–0.5%), Form III (0.5–0.75%), Form IV (0.75–1.0%). The helices that move are labeled and depicted in dark cyan. Dotted lines represent disordered regions in the crystal structures. The inset shows the hydrogen bonds which maintain the closed state but are disrupted in the open forms. The following residues are missing in the final refined structure: Form I (68 in molecule-1 and residues 63–69,104–108, and 119–120 in molecule-2), Form II (122 in molecule 1 and 119–120 in molecule 2); Form III (122), and Form IV (231–239). Otherwise, the electron densities throughout all of the polypeptide chains were high quality.

